LETTER | Is the worse really over?
LETTER | On Feb 9, Health Ministry director-general Dr Noor Hisham Abdullah believes that the second movement control order (MCO 2.0) is working and says Malaysia has turned the corner in its fight against Covid-19. This statement can be contested as it is not backed by any relevant data.
The number of positive cases can easily drop if tests are not done or tests are targeted at a healthy population, which resulted in low positive cases being detected. Statements not supported by data can always be challenged.
Similarly, Health Minister Dr Adham Baba also stated that improvement has been made based on the fact no new cases have been detected among the interstate clusters. Isn't it jumping the gun?
How can such a conclusion be made based on a one-day negative test among the cluster contacts? There might be positive cases that have not been tested yet or results that are still pending. A 7-14 day negative test is needed to support such statements.
To convince the public, the Health Ministry needs to show the number of tests being done by localities. Malaysia has a population of 33 million (not including five million foreigners) and they are well distributed. Without knowing the distribution of new tests being done, conclusions with huge variances may give the wrong picture.
We have been observing the number of cases being discharged daily. Since we know that the Health Ministry admits patients under 14 days of 10 days protocol and discharge them with either negative test or without symptoms, one would expect the discharge trend to match the 80 percent of the previous 10th or 14th-day admission.
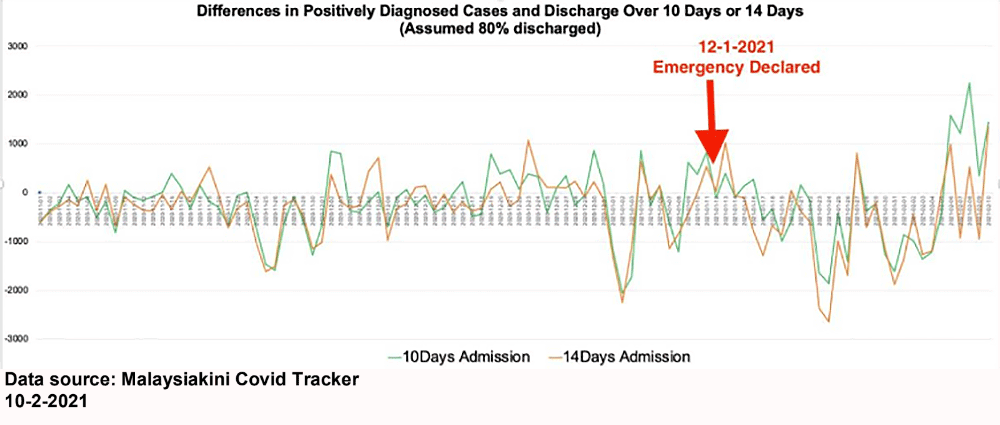
It is assumed that 20 percent of the patients are retained in hospital (or have died). The number of discharge variance and positive cases are plotted below. One would assume that differences would be close to zero for the corresponding period of D10 or D14.
However, the graph below showed a different story. A daily variation from negative 2,800 cases to positive 2,000 cases is noted. Negative figures mean that there are more discharges than new cases being identified on the corresponding date. How is this possible? This suggests that either there is a huge error in reporting or simply clever data manipulation.
We could see the trend begins to fluctuate about three weeks before the proclamation of emergency was made and it continues to show significant fluctuations during the period of the emergency. This corresponds with the instability of Prime Minister Muhyiddin Yassin's position. Why do we see such a huge variation?
Minor variation close to zero is a norm but a variation of a few thousand cases raises red flags. The ministry and the government owe the people an explanation.
The views expressed here are those of the author/contributor and do not necessarily represent the views of Malaysiakini.
RM12.50 / month
- Unlimited access to award-winning journalism
- Comment and share your opinions on all our articles
- Gift interesting stories to your friends
- Tax deductable

